
1. What are DNA motifs?
A DNA motif is a region of DNA that regulates the expression of downstream genes located on that same molecule of DNA, i.e., a chromosome. This concept is equivalent to a DNA cis-regulatory element or cis-element. It contains the transcription factor binding sites (TFBSs) and other conserved functional elements in the 5 intergenic regions of genes. We use motifs instead of DNA motifs in the following sections.
2. What can DMINDA2 do in motif analyses?
Our server has a number of novel capabilities:
(i) motif identification in prokaryotic genomes by an integrative and applicable phylogenetic footprinting framework
(ii) bacterial regulon modeling and prediction based on systematic motif analyses
(iii) de-novo motif finding
(iv) motif refinement and evaluation based on information extracted from the entire genome and a phylogenetic footprinting method
(v) motif scanning based on a global P-value estimation method
(vi) motif comparison and clustering using a novel and effective technique
(vii) motif co-occurrence analysis in the regulatory regions
3. How does DOOR2 database support DMINDA2?
DOOR2 is a complete and reliable operon database covering 2,072 bacteria genomes and with overall accuracy of ~90% evaluated by Brouwer (2008) in Brief Bioinformatics. It is currently integrated into DMINDA2. Specifically, for motif analyses in prokaryotic genomes, the users can select operons and corresponding promoters on DMINDA2 directly.
4. What kinds of formats of input DNA sequences are acceptable for DMINDA2?
FASTA is the only acceptable format.
See details in FASTA format
5. What kinds of formats of motifs are acceptable as input for DMINDA2?
Currently we accept three kinds of motif formats, shown as follows,
Motif alignment
AACATTTAGTTAACC
TAAAAATTGTTAACA
AAAACTTGATTAACA
AACATTTAGTTAACT
AACAATTATTTAACA
TAATTATTATTAACC
AAAATATAATGAACA
A 40 47 23 42 23 33 12 23 40
G 5 6 8 9 5 15 0 13 26
C 7 5 30 7 14 1 5 14 0
T 23 17 14 17 33 26 58 25 9
GCTTTTGATGACTTCAAACAC
W = A or T
S = C or G
R = A or G
Y = C or T
K = G or T
M = A or C
B = C, G, or T (not A)
D = A, G, or T (not C)
H = A, C, or T (not G)
V = A, C, or G (not T)
N = A, C, G, or T
6. What is a position weight matrix (PWM)?
A position weight matrix (PWM), also known as a position-specific weight matrix (PSWM), is a commonly used representation of motifs (patterns) in biological sequences. PWMs are often derived from a set of aligned sequences that are thought to be functionally related.
A PWM has one row for each symbol of the alphabet: 4 rows for nucleotides in DNA sequences. It also has one column for each position in the pattern. A basic PWM using relative frequencies is constructed by counting the occurrences of each symbol at each position and then normalizing at each position. Formally, given a set X of N aligned sequences of length l, the elements of the PWM M are calculated:
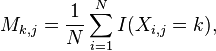
where i = 1,...,N, j = 1,...,l, k is the set of symbols in the alphabet and I(x) is an indicator function.
More details can be found in Position Weight Matrix.
7. What is a Position-Specific Scoring Matrix (PSSM)?
Often the element in PWMs are calculated as log likelihoods. That is, the elements of the PWM are transformed using a background model so that:
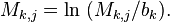
The simplest background model assumes that each letter appears with equal frequency in the dataset. Applying this transformation to the aforementioned PWM M, we have:
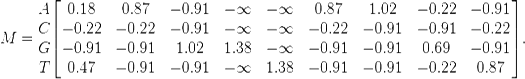
The entries -∞ in the matrix make clear the advantage of adding pseudo counts, especially when the small datasets are used to construct M. It is noteworthy that the background model don't need to have equal values for each symbol. For example, when studying organisms with a high GC-content, the values for C and G may be increased with a corresponding decrease for the A and T values.
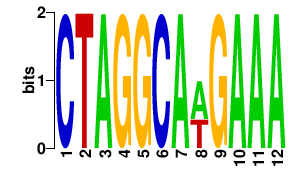
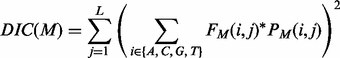
8. What is the information content of a PWM?
The information content (IC) of a PWM is how different it from a uniform distribution.
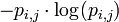
The self-information of observing a particular symbol at a particular position of the motif is:

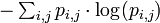
The expected (average) self-information of a particular element in the PWM is then given by:
Finally, the IC of the PWM is the sum of the expected self-information of every element:
Often, it is more useful to calculate the information content with the background letter frequencies of the sequences you are studying rather than assuming equal probabilities of each letter (e.g., the GC-content of DNA of thermophilic bacteria range from 65.3 to 70.8, thus a motif of ATAT would contain much more information than a motif of CCGG). The equation for information content thus becomes
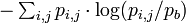
where Pb is the background frequency for that letter. This corresponds to the Kullback-Leibler divergence or relative entropy. However, it has been shown that when using PSSM to search genomic sequences, this uniform correction can lead to overestimation of the importance of the different bases in a motif, due to the uneven distribution of n-mers in real genomes, leading to a significant false positives problem.
9. What is GOST?
Global Optimization Strategy (GOST) is a novel algorithm for orthologous gene mapping through combining sequence similarity and contextual (working partners) information, using a combinatorial optimization framework. GOST overcomes two general problems of existing methods: (i) they are computationally too slow and their results are difficult to interpret for automated large-scale applications when based on phylogenetic analyses; or (ii) they are too prone to making mistakes in dealing with complex situations involving horizontal gene transfers and gene fusion due to the lack of a sound basis when based on sequence similarity information.
10. What is a regulon and why is it important?
The term regulon was first introduced by Maas et al. in 1964, intended to name a maximal group of co-regulated operons, which may be scattered in a genome without apparent patterns in terms of their genomic locations. A successful elucidation of regulons will substantially improve the identification of transcriptionally co-regulated genes encoded in a bacteria genome, realistically allowing reliable prediction of global transcription regulation networks.
11. How do you identify motifs in prokaryotic genomes with a phylogenetic footprinting framework?
The proposed integrative phylogenetic footprinting framework is based on a new orthologous data preparation procedure, a novel promoter scoring, and a pruning method,
in support of accurate motif prediction. Specifically, we collected orthology broadly from available prokaryotic genomes and built the orthologous regulatory regions based on sequence
similarity of promoter regions. This procedure not only fully made use of the large-scale genomic data and taxonomy information, but also filtered out the promoters with limited contribution,
and hence can produce the high quality reference set. Additionally, the promoter scoring and pruning is implemented through motif voting by a set of complementary predicting tools,
which mine as many motif candidates as possible and eliminate the effect of random noise simultaneously.
12. How do you perform bacterial regulon modeling and prediction based on systematic motif analyses?
Regulon prediction is a new computational framework including a novel graph model used to integrate motif comparison and clustering and make the regulon prediction problem substantially more
solvable and accurate. This framework takes full advantage of a novel co-regulation score between a pair of operons based on accurate operon identification and motif analyses, which can capture
their co-regulation relationship much better than other scores.
13. How do you identify de-novo motifs?
The de-novo motif finding program, BOBRO, is published in Nucleic Acids Research, 2011.
It is an algorithm for cis-regulatory motif prediction in a given set of promoter sequences. The algorithm substantially improves the prediction accuracy and extends the scope of applicability of the existing programs based on two key new ideas: (i) a highly effective method for reliably assessing the possibility for each position in a given promoter to be the (approximate) start of a conserved sequence motif; and (ii) a highly reliable way for recognition of actual motifs from accidental ones based on the concept of motif closure. These two key ideas are embedded in a classical framework for motif finding through finding cliques in a graph but have made this framework substantially more sensitive, as well as more selective in motif finding from a very noisy background. A comparative analysis shows that the performance coefficient was improved from 29% to 41% by our program compared to the best among other six state-of-the-art prediction tools on large-scale data sets of promoters from one genome, and also consistently improved by substantial margins on another kind of large-scale data set of orthologous promoters across multiple genomes. The power of BOBRO in dealing with noisy data was further demonstrated through identification of the motifs of the global transcriptional regulators by running it over 2390 promoter sequences of Escherichia coli K12. The related data sets and results can be found at: [BOBRO 2.0].
14. How do you refine the predicted motifs?
The motif refinement and evaluation function is so called BBR (BoBro-based motif refinement), a method for filtering out noises among predicted motifs at a genome scale. Consider a genome-scale motif prediction problem: denote all the motifs predicted by a de-novo motif finding tool as  ; R and C represent the given set of regulatory sequences for motif identification and a control sequence set, respectively. For any motif
  , it is considered as a motif if it satisfies the following three criteria: (i) the P-value of m with respect to a hypothesis that it appears in R by chance is below a specified cutoff value; (ii) R is more enriched in the instances of m than C, as defined in formula (1); and (iii) m is well-conserved across a diverse set of species, as defined in formula (2).
Criterion (i) is measured using the P-value defined in our previous work (Li et al., 2011). Specifically, let x be a random variable denoting the number of instances of a motif in a given set of regulatory sequences, and its probability distribution, p(x), can be approximated using a Poisson distribution. Hence, the P-value of a motif can be calculated by summing up the probability of p( ) over, denoting that the motif has at least k instances. An enrichment score is defined to evaluate the statistical significance of the ratio between the number of m instances in R and that in C, as given in the following,
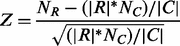 (1)
(1)
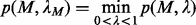
where NR and NC are the numbers of instances of m in R and C, respectively; and |R| and |C| are the sequence lengths of R and C, respectively. Criterion (iii) is defined in terms of the average enrichment score defined in formula (2), with each Z term being defined in (1) for each organism over a set of diverse species and the original genome.
 (2)
(2)
where
 represents a set of species and
  is m enrichment score in species i,
  . We consider a motif as statistically significant if its P < 3.3e-5 (the P-value threshold has been corrected for multiple testing based on the estimated number, 300, of TFs in E. coli). Criteria (ii) and (iii) are designed to ensure that predicted motifs will be as biologically meaningful as possible (Bailey, 2011).
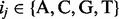
15. How do you perform motif scanning for additional motif instances across a genome based on known or predicted motifs?
The motif scanning function is so-called BBS (BoBro-based Scanning), scanning and ranking new instances of a query motif based on P-values. A key to reliable motif-scanning at a genome scale is the ability to effectively evaluate the similarity between a motif instance and a query motif (Das and Dai, 2007; Haverty and Weng, 2004; Medina-Rivera et al., 2011; Thomas-Chollier et al., 2008). Obviously, different similarity cutoffs may result in different scanning results. BBS provides a global P-value for the entire motif instances for each motif scan. We first introduce a few definitions; let M be an aligned query motif of L nucleotides long and its PWM  is defined as a 4-by-L matrix, given in (3):
 (3)
(3)
where  is the probability of nucleotide
  appearing at position j in M; and
  is the probability of i appearing in the background sequences, e.g., all the promoter sequences in the entire genome. Comparing with the traditional PWM model that assumes independence among different sequence positions, we assumed first-order Markov-chain property among consecutive sequence positions in our model. We generated a transition matrix
  , with
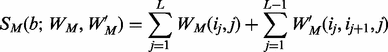
  representing the probability of a specific nucleotide with type i followed by a specific nucleotide with type i in consecutive positions j and j + 1 of the query motif. The similarity between a motif instance
 and a query motif M is measured using:
 (4)
(4)
Consider a motif  with t instances
  , the average similarity
  between
  and M is measured using the following:
 (5)
(5)
A  closure of M, denoted as
  , is a set of sequence segments in the input regulatory sequences, each having a similarity score no less than
  . Our previous experience suggests that the documented cis-regulatory motifs tend to have significantly more instances with high similarities among them than the accidental ones, and the size of a
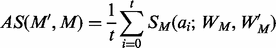
  closure provides a good measure for this (Li et al., 2011). The P-value
  of
of  can be approximated using a Poisson distribution based on our previous work (Li et al., 2011). We can select a
  value
value  so that the
  closure of M can give the best motif prediction performance measured in terms of prediction sensitivity and specificity. One way to accomplish this is through finding a
  that minimizes the following function:
 (6)
(6)
This capability can be used to derive an optimal similarity cut-off for motif scanning on a statistically sound basis.
16. What is a background genome?
The background genome used in DMINDA2 represents an entire genome or a set of control regulatory sequences which don't contain query motifs. Such a background genome can be used to refine and evaluate the predicted motif by generating a Z-score.
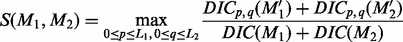
17. How do you perform motif comparison between predicted motifs and annotated motifs in motif databases?
The motif comparison function utilizes weak conserved signals of motifs flanking regions in motif comparison. We have observed that the flanking regions of cis-regulatory motifs tend to have some level of sequence conservation, and we have developed the following procedure to take advantage of this information in motif comparison. Define a deformation of information content (Schneider et al., 1986) for a motif M of length L as follows:
 (7)
(7)
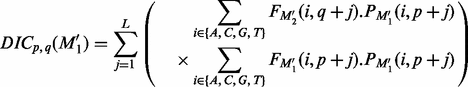
where 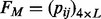 and the other items are the same as in formula (3). Consider two motifs M1 and M2 with lengths L1 and L2, respectively, and L= min {L1,L2}. Let M1 and M2 be the two extended motifs formed by concatenating the
  and
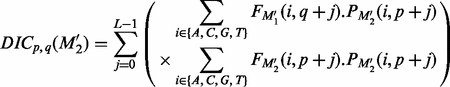
and  nucleotides on each side of each motif instance sequence of M1 and M2, respectively (If the location information of given motifs in their original genome is available, we can use the flanking region of each motif to generate the extended motif sequence); hence, their lengths are 2*L1 and 2*L2. The similarity between the extended instances of M1 and M2 is defined as follows:
 (8)
(8)
Where
 (9)
(9)
.
 (10)
(10)
18. What is the theoretical complexity of the back-end algorithms and acutal computational capability of DMINDA2?
Table 1. The theoretical complexity, real computation time and parameters of related tools; L and n means motif length and the number of motif instances, M and N means the size of input promoter sequences and control sequences (number of nucleic acids), P means the number of promoters involved, t is the number of simulations for calculation of the p-values of motif closures. All the programs are implemented on a computer with 64GB memory and 6 CPU (E5-2650 v3 @ 2.30GHz).
| Program | Theoretical time complex | Input | Real | User | Sys | Parameter |
| BOBRO | O(M2L2)+O(tML) | 2390 length 300nt promoters | 1825m | 1823m | 1m19s | -k 5 -c 1.00 -u 0.70 -e 3 -w 2.00 -b 0.95 -N 5 -l 14 -F -o 500 |
| BOBRO | O(M2L2)+O(tML) | 2390 Intergenetic regions | 2181m | 2178m | 1m2s | -k 5 -c 1.00 -u 0.70 -e 3 -w 2.00 -b 0.95 -N 5 -l 14 -F -o 500 |
| BBS | O(Ln+LM) | 245 Human motif and promoter | 161m | 160m | 0m41s | -w |
| BBR | O(LM+LN) | ~300 motifs ,271 reference genomes | 2311m | 2254m | 27m | -- |
| BBC | Comparison/Clustring : O(Ln) /O(n2logn) | Pairwise Comparison 561 motifs | 1m | 0m22s | 0m14s | Clustering: T1: 0.85; T2:0.91 |
| BBA | O(Pn) | 159 E. coli motifs pair-wise analysis (12561 pairs) | 41m57.215s | 21m53.203s | 10m22.731s | -- |
Table 2. The actual computational time of samples and some large-scale jobs on DMINDA2. Note: The number of output motifs should be less than 100, otherwise they will be too slow to be displayed.
| BoBro | BBS | BBC | BBA | |
| Sample data | JobID: 20140316135117f Input: 19 promoters Output: 8 motifs Time: 120s |
JobID: 20140316133439s Input: 5 motifs and 19 promoters Time: 50s |
JobID: 20140316133454c Input: 5 motifs Time: 9s |
Input: 8 motifs and 19 promoters Time:6s |
| A biological pathway: TCA cycle | JobID: 20140120153137f Input: 17 promoters Output: 10 motifs Time: 238s |
JobID: 2014031691048s Input: 10 motifs and 17 promoters Time: 74s |
JobID: 2014031691441c Input: 10 motifs and 17 promoters Time:16s |
Input: 17 promoters and 10 motifs Time: 8s |
| A Bacterial genome: NC_012034 | JobID: 20140316125905f Input: 1,272 promoters Output: 80 motifs Time: 6,908s |
Job ID: 20140316151804s Input: 80 motifs and 1,272 promoters Time: 448s |
JobID: 20140316151926c Input: 80 motifs and 1,272 promoters Time: 20s |
Input: 80 motifs and
1272 promoters Time: 527s |
| The Human genome | N/A | JobID: 20140316101840s Input: 5 motifs and 20,044 promoters Time: 447s |
JobID: 20140316103154c Input: 5 motifs and 20,044 promoters Time: 13s |
Input: 5 motifs and
20,044 promoters Time: 4s |
| Limit of to-be-shown motifs | 100 | 100 | 100 | 100 |
19. How do you perform motif clustering on DMINDA2?
Motif clustering uses the new similarity measure: a group of motifs can be clustered into subgroups composed of similar motifs using the following algorithm, which is based on a maximum spanning tree (MST) representation of the candidate motifs. First, consider a complete graph defined over a list of candidate motifs, each represented as a node and each pair of motifs connected by an edge; the weight of an edge is the similarity between the two corresponding motifs (see Fig. 1a). An MST of the graph is constructed using Kruskals algorithm (Thomas, 2001). We have clustered the predicted motifs based on two different similarity thresholds, T1 and T2, giving rise to two classes of motif clusters, namely, highly reliable and relatively reliable motif clusters, respectively. We have compared each pair of documented motifs in the RegulonDB database (Salgado et al., 2013) and assigned the median and the upper quartile of all the similarities to T1 and T2, respectively. Each of the two thresholds is used to remove edges with similarities lower than the threshold, giving rise to the final list of motif clusters (see Fig. 1) represented as a connected sub-tree of the MST after applying the threshold. Then, all instances of each motif cluster are mapped back to the original regulatory sequences, facilitating further analysis and interpretation of the motif-prediction results.
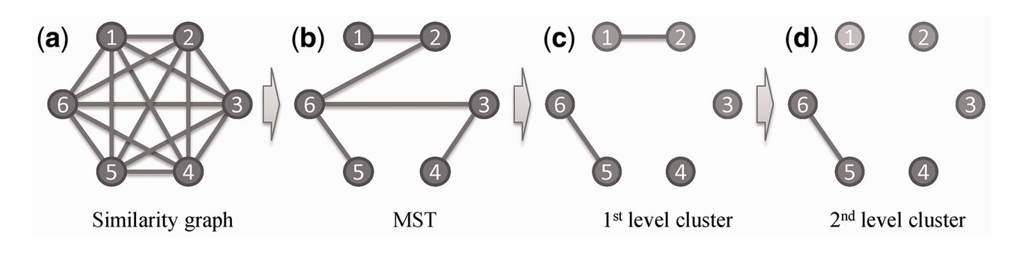
Figure 1: An example of a two-level clustering of motifs using a minimal spanning tree, consisting of six motifs: (a) a complete similarity graph is constructed with the weight of each edge representing the two corresponding motifs similarity; (b) an MST {(1,2), (2,6), (3,6), (3,4), (5,6)} is constructed using Kruskals algorithm; (c) four connected components of the MST created using the first-level threshold , i.e. {1, 2}, {5, 6}, {3} and {4}, reflecting that motifs 1 and 2 and 5 and 6 are similar compared with the other motif pairs; and (d) the motif cluster {1, 2} is split into two dependent motif clusters {1} and {2} using the threshold , reflecting that the similarity between motifs 1 and 2 are lower than that between motifs 5 and 6.
20. How do you perform motif co-occurrence analysis?
We have implemented a function BBA to evaluate the co-occurrences among the identified motifs in a given set of regulatory sequences, which can reveal joint regulation relationships by multiple TFs. For a given motif pair a and b, and the entire set of promoter sequences P, let A and B be the subsets of P that contain motif instances of a and b, respectively (we assume, without loss of generality,  ). Let k=
  , then the probability of A and B sharing k promoter sequences can be calculated using the following hyper-geometric function:
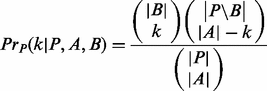 (11)
(11)
The P-value of a and b co-occurring in the same regulatory regions is calculated as the probability of A and B sharing at least k regulatory sequences. For a pair of motifs, a significant P-value means their instances tend to occur in same regulatory sequences, hence indicating that their corresponding TFs may co-regulate the same genes with high probability.
21. Where can I get the algorithm parameters for my submitted job?
All the algorithm parameters can be found at the top of the results which are ready for download in the upper, right-hand corner.
22. Where can we download the source codes of your programs along with their documentations?
Please go to Download for the source codes along with their documentations.
23. What are the performances of your motif analysis functions compared to other programs?
We have carried out systematic comparisons between motif predictions by BoBro2.0 and by the MEME package. The comparison results on E. coli K12 genome and the Human genome show that BoBro2.0 can identify the statistically significant motifs at a genome scale more efficiently, identify motif instances more accurately and get more reliable motif clusters than MEME. In addition, BoBro2.0 provides correlational analyses among the identified motifs to facilitate the inference of joint regulation relationships of transcription factors. More details can be found in the following reference:
24. Do I have to leave my email address for retrieving the results?
No, the email address is optional. You can record your unique job ID and retrieve your results using the search bar on DMINDA2's homepage.
25. How to cite your papers?
Please refer to Cite us.